Invite only teams that can execute the project.
Compare team options by specialisation, available capacity, completed comparable projects and a verifiable BCC Company Index before issuing invitations to tender.
Executable-team selection. Completion-risk assessment. National market statistics and deep explanation of the BCC indices — built on 23 years of real projects and participants.
BCC Terminal brings together the full statistical picture of the market, explains the indices behind it and connects that intelligence with the specialisation, capacity and delivery history of real participants.
Compare team options by specialisation, available capacity, completed comparable projects and a verifiable BCC Company Index before issuing invitations to tender.
Assess execution risk and a realistic timing range from the investor, the selected team and their history with comparable projects. The lending or investment decision remains yours.
THE LEVEL DESCRIBES THE IDENTIFIED RISK · THE LINE BELOW EACH FACTOR STATES THE EVIDENCE BASIS
National statistics on projects, floor area, phases, segments, regions and participants. Terminal goes beyond an index value to explain the movement, components, methodology and connection to real projects.
Explore market intelligence→Market dynamics, activity and structure across Bulgaria's construction-investment market.
Comparable company assessment grounded in actual roles, projects and delivery history.
A forthcoming price index for the Bulgarian real-estate market.
A commercial register shows what is filed about a company. BCC shows what it has actually built, who it built with and whether its profile fits the next project.
ILLUSTRATIVE VIEWS · NO CLIENT DATAThe method does not produce a generic risk score or an automated credit decision. It organises verifiable facts into three outputs: timeline, team and capacity, and principal risks.
Country, use, phase, comparable GLA and history available at the analysis date. The assessed project is excluded from its own comparison cohort.
The timeline runs in months from the analysis date to the canonical Completed phase. It uses observed transitions; unfinished projects are not removed from the analysis.
Current and forecast load are compared with the evidenced 36-month peak for each role. Load above the historical peak is a limitation, not an automatic delay.
Every signal carries a fact, comparison basis, meaning for the project, reliability and required confirmation. Missing information is not automatically classified as high risk.
The real Terminal Risk Assessment screen will appear here.
The supplied product image will be added here without changing the methodology copy or exposing client data.
The assessment does not cover budgets and costs, legal status and encumbrances, or creditworthiness. Those checks and the final credit or investment decision remain within your process.
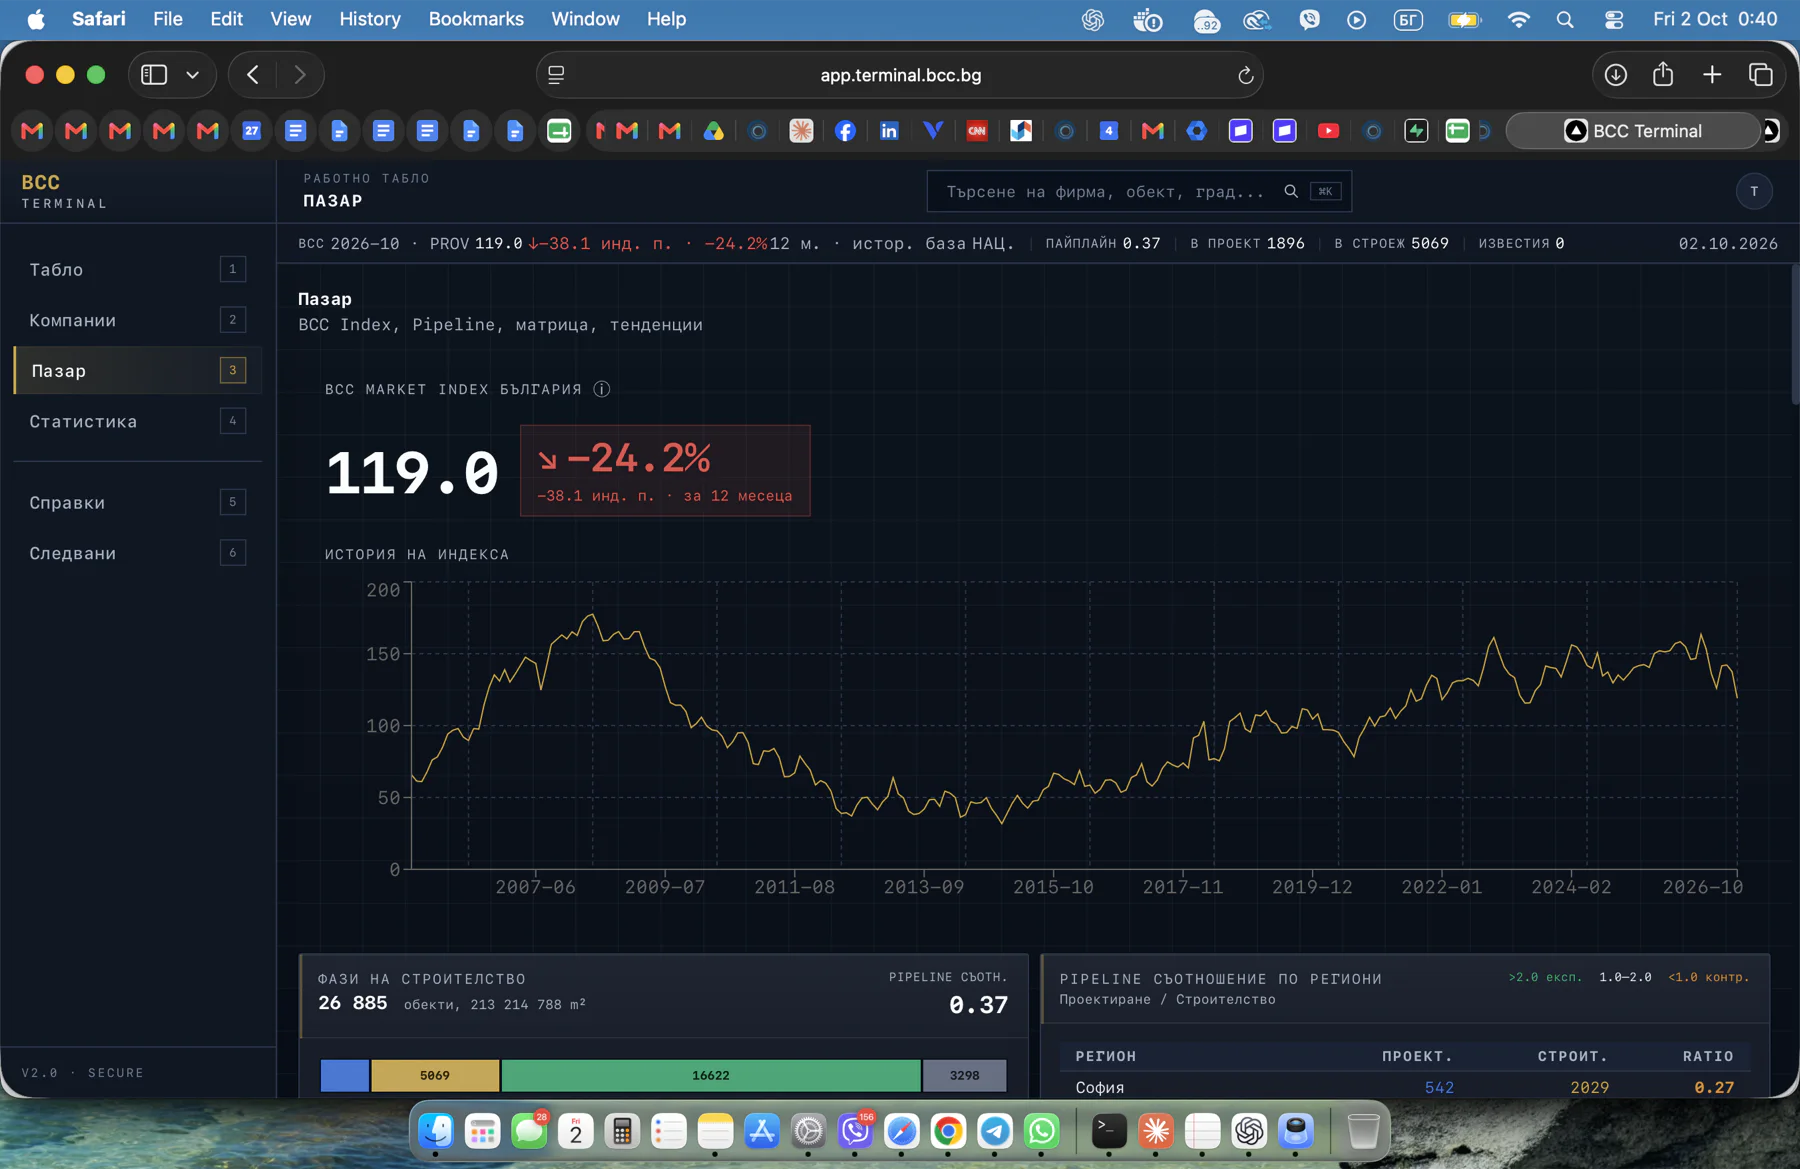
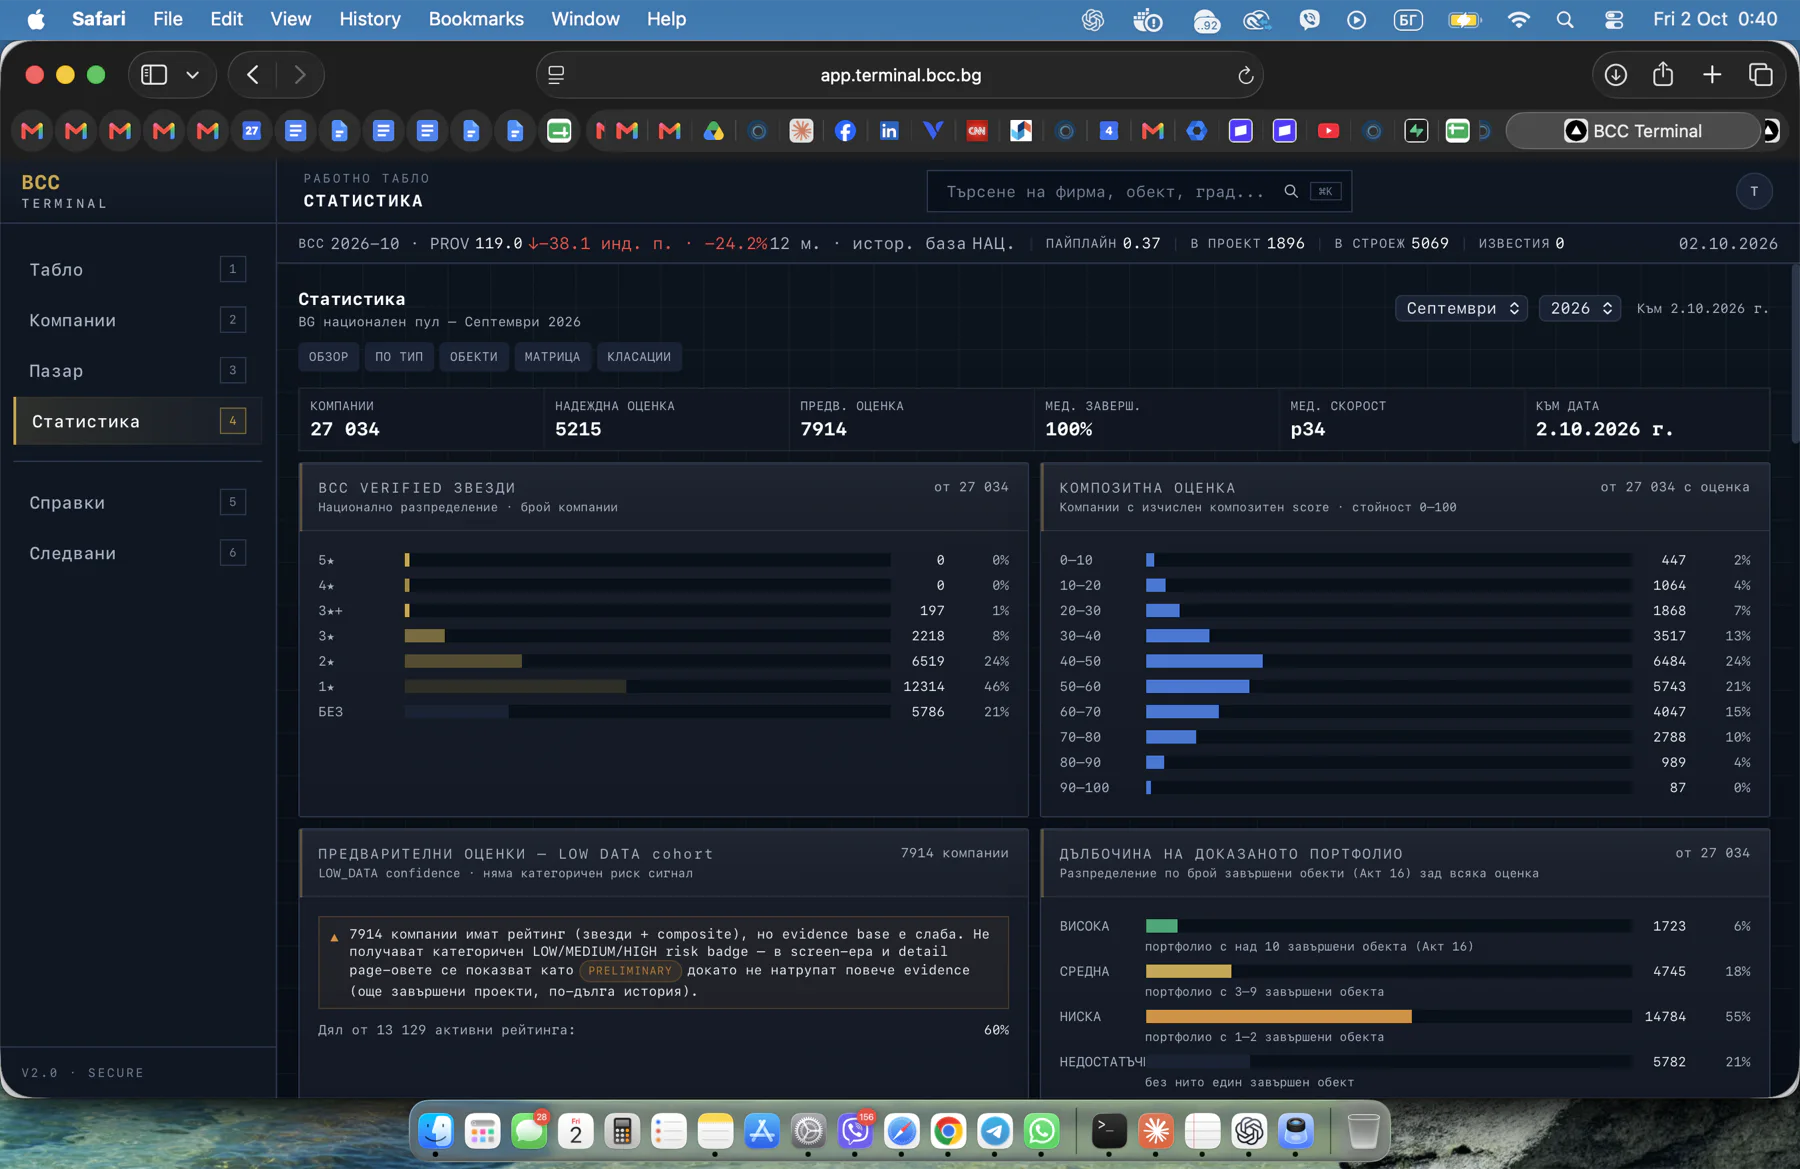
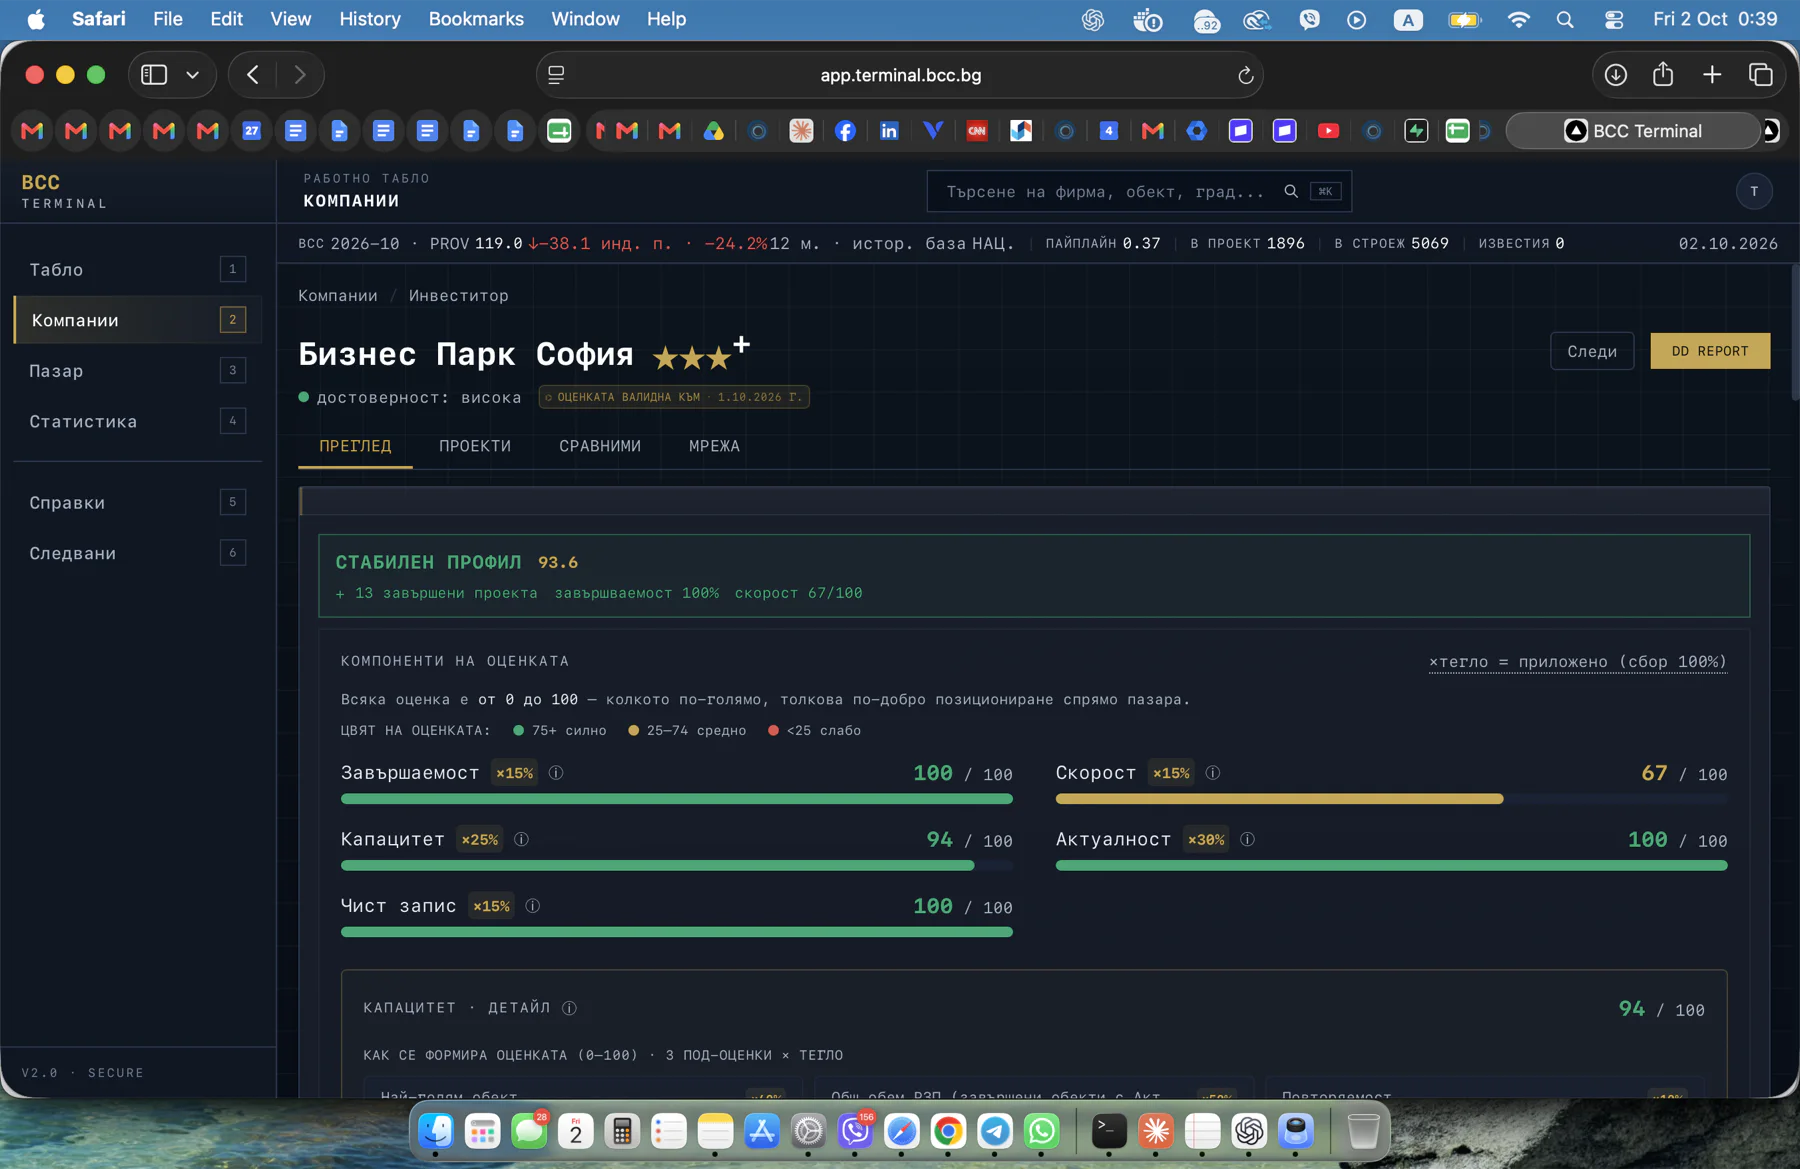
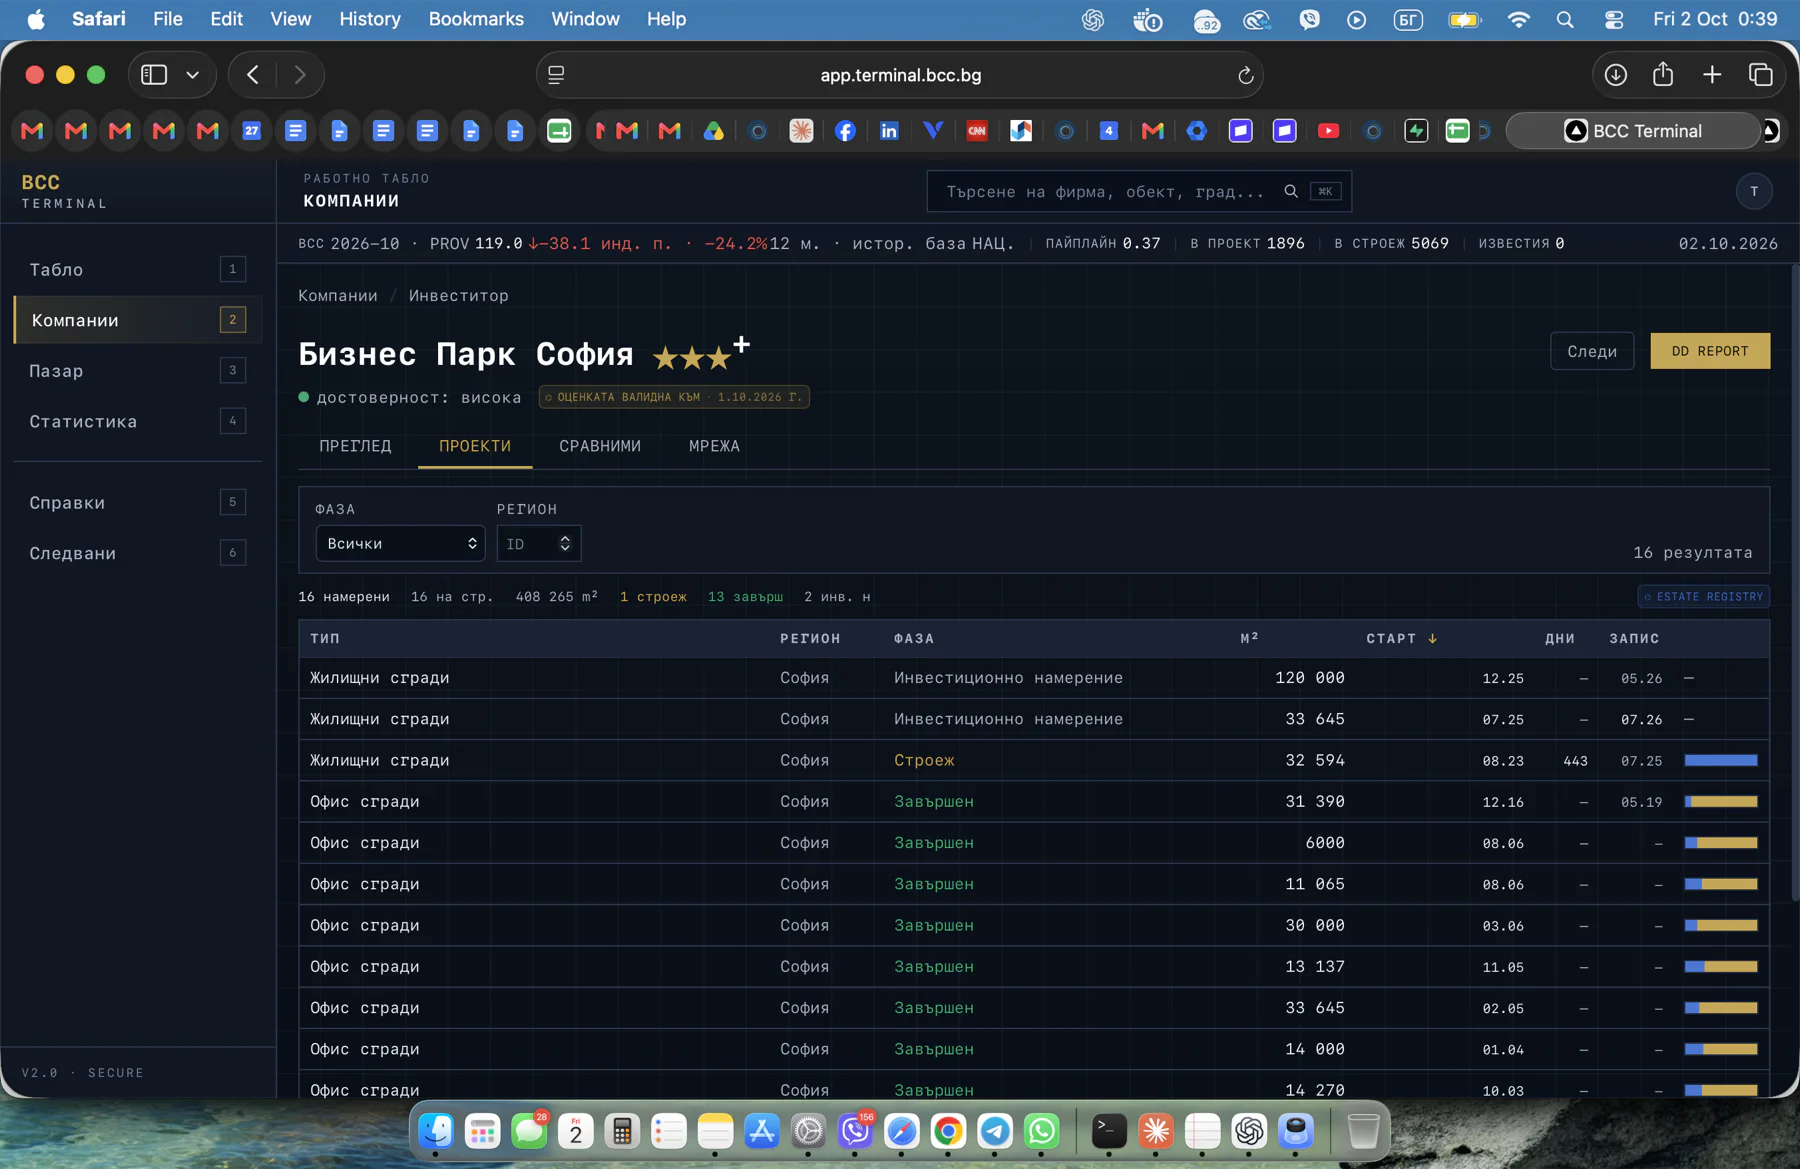
From market movement to the history of a specific company, Terminal keeps analysis, comparison and evidence in one consistent interface.

Index history, current movement, construction phases and the regional pipeline in one screen.

Distributions, assessment reliability and proven-portfolio depth across the full national pool.

Rating, components, weights and the specific evidence behind the result.

Projects, phases, floor area, regions and the company's role on each project.

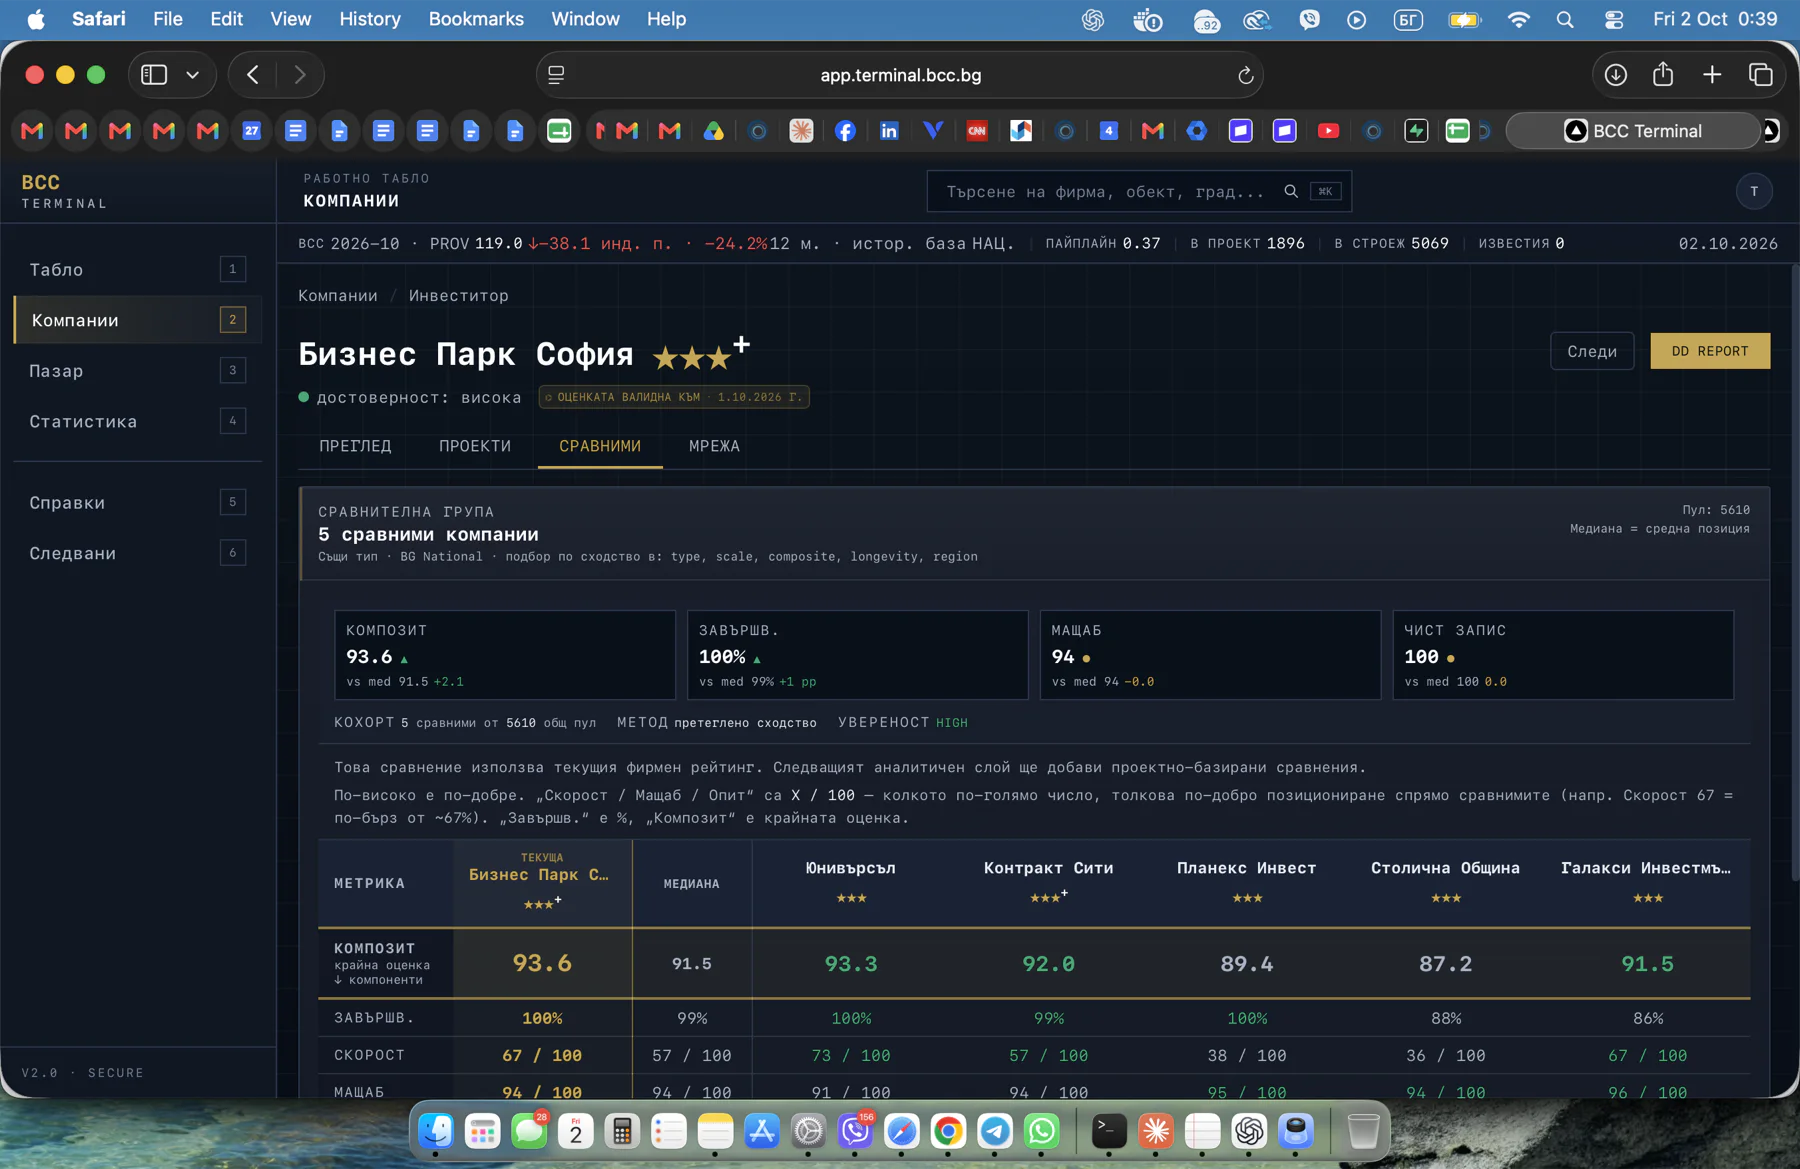
Like-for-like positioning against companies that are genuinely comparable.

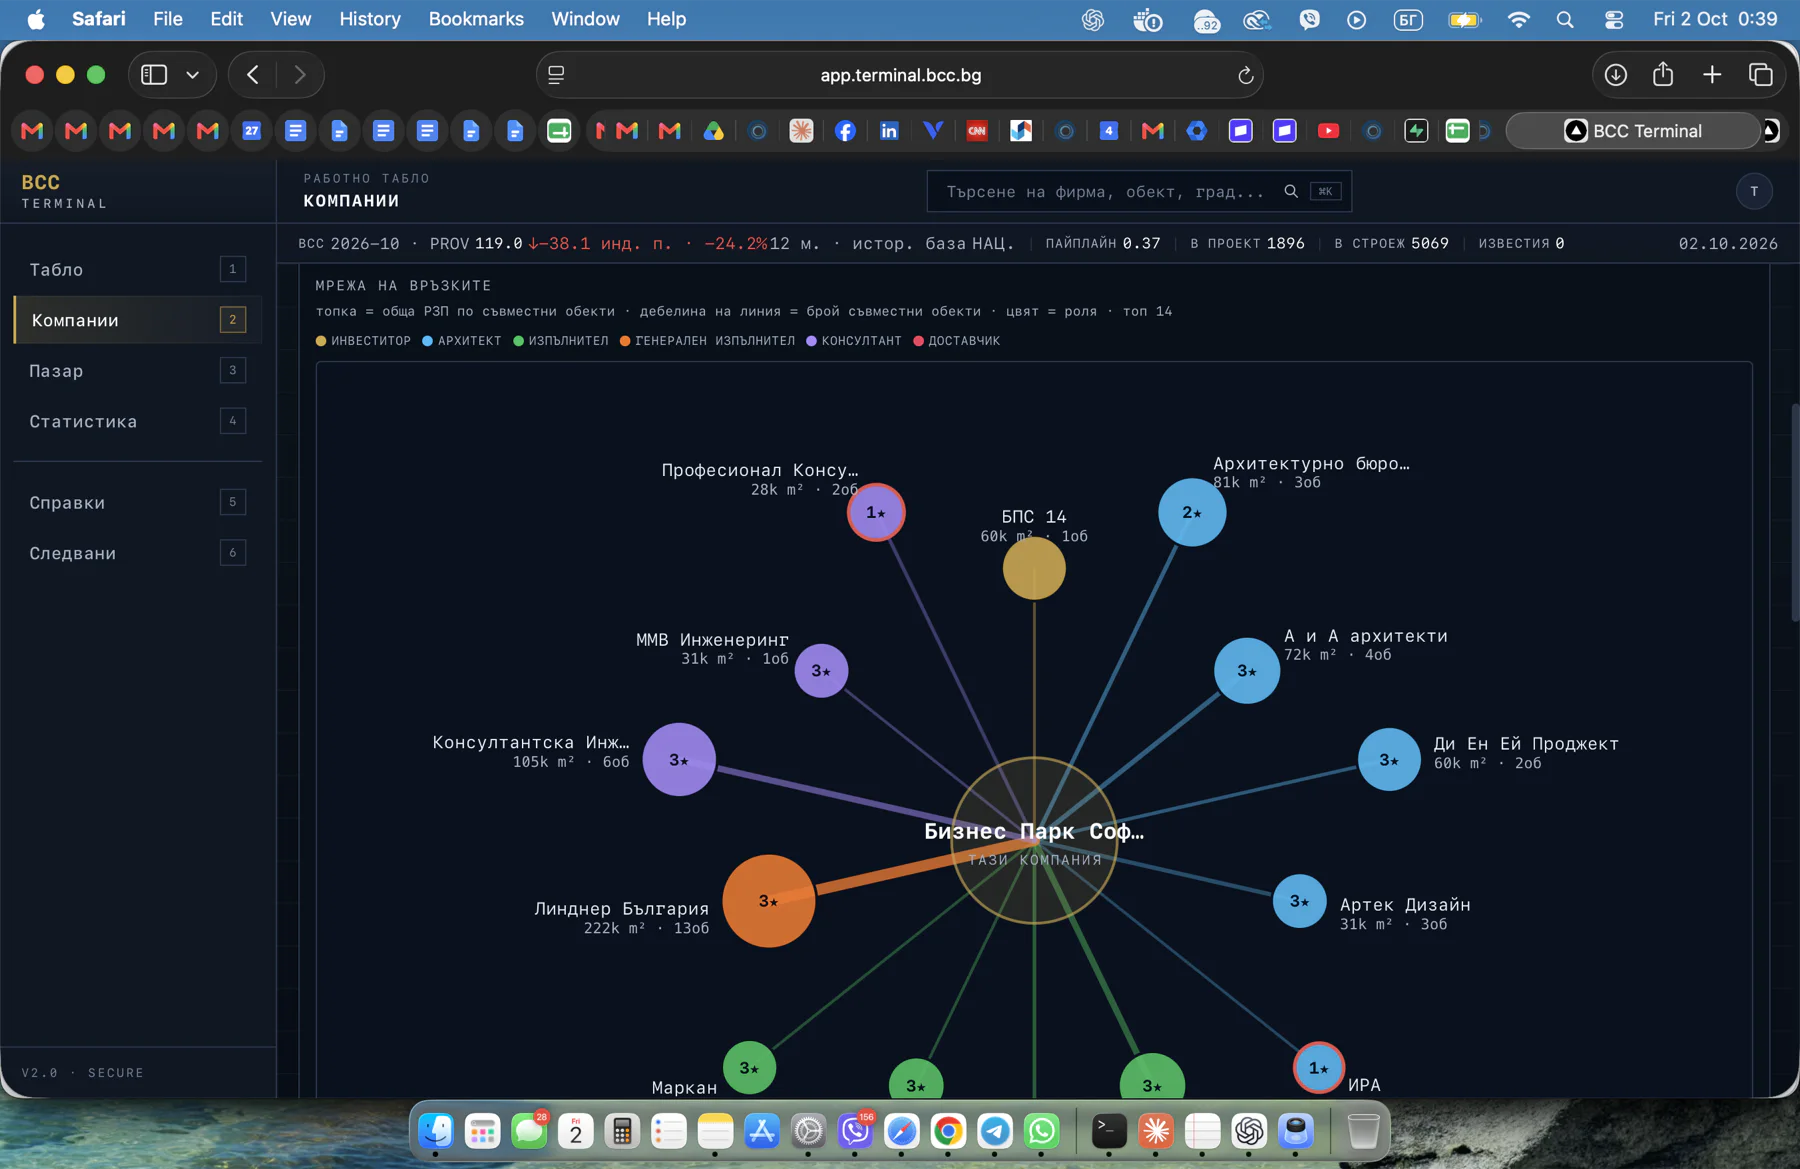
Connections among investors, designers, contractors, consultants and suppliers.
REAL PRODUCT VIEWS · DATA AS OF 02 OCT 2026
Outcome: a structured assessment of the investor, team, timeline and key dependencies.
For banks→TEAM SELECTIONOutcome: a tender shortlist compared on the same verifiable criteria.
For developers→INVESTMENT SCREENINGOutcome: project and participant evidence structured for investment review.
For funds→PORTFOLIO MONITORINGOutcome: signals when a phase, participant or other material fact changes.
For funds and banks→COUNTERPARTY REVIEWOutcome: role profile, completed projects, partners and BCC Company Index.
Company profiles→Terminal shows the source, date and basis behind each material signal. The detailed project-risk methodology is available after sign-in together with the assessment's specific data and limitations.
After sign-in, users can inspect the full logic for timeline, capacity and principal-risk assessment.
Each assessment carries its date, applied methodology, source and comparison basis.
Limitations and missing facts appear beside the result and are not automatically converted into a high-risk conclusion.
Tell us the situation or workflow you want to support. Our banking, fund or partnerships lead takes the request and replies within one business day.
First call is 15–20 minutes · named lead · no marketing automation